In this article 16 sections
- Why the press takes the blame
- Time the waits, not the tasks
- The one-week bottleneck log
- The handoffs to timestamp
- What each row records
- Rules that keep the log honest
- Worked example: one embroidered polo order
- Read the week, not one order
- A quick sense check with Little's Law
- The three usual culprits
- 1. Waiting on the customer
- 2. Waiting on stock
- 3. Jobs released to production incomplete
- Fix one thing, then measure again
- What a wrong diagnosis costs
- Your next step this week
Orders come in steadily and customers say yes. Then something slows down between the sale and the finished box. By Thursday the embroidery machine or press is running flat out on jobs promised for Tuesday, and everyone looks at the machine.
The short answer is that the machine is rarely where the time goes. For one week, record when each order reaches every handoff and when someone actually starts on it. Then add up the waiting by stage. Your bottleneck is the stage with the biggest total wait in front of it, not the stage people complain about. In decorated goods, the usual suspects sit before production: waiting on the customer, waiting on stock, and jobs released to the floor before they are ready. Treat those as hypotheses for your log to confirm or rule out.
Why the press takes the blame
Production is the stage you can see and hear. When it is busy, everyone knows. A job waiting for a customer to approve a proof makes no noise. It sits in an inbox, and the status board says “awaiting approval” without saying since when.
So jobs reach production late, in bunches, or with something missing. The machine looks overloaded on Thursday and idle on Monday, and the obvious conclusion is that you need more capacity. That conclusion is expensive if it is wrong. A second machine adds capacity at a stage that was not limiting flow, and orders still queue where they always did.
The Theory of Constraints Institute lists “identify the system’s constraint” as the first of its Five Focusing Steps. The constraint is the one stage that limits how much work gets through. Everything else depends on finding the right one.
Time the waits, not the tasks
Most owners know how long a run takes, how long it takes to digitise a logo, and how long it takes to pack a large order. Those are task times. They are useful for quoting, but they hide the queue.
The Lean Enterprise Institute makes the distinction in its value-stream mapping overview. Cycle time is how long an operator takes to complete their own work. Lead time is how long one piece takes to move through the whole process from start to finish. The gap between the two is waiting, and it only shows up when you time the whole journey.
Many shops already track status on a whiteboard, a job bag, a spreadsheet or an order system. The weak point is that they record the current status but not when that status began. Add one column for a timestamp and the status board becomes a way to measure.

The one-week bottleneck log
The handoffs to timestamp
Record the date and time each order reaches these points. Not every order hits every point, and that is fine.
- Order confirmed
- Artwork received in a usable format
- Proof sent
- Proof approved
- Stock ordered
- Stock received
- Scheduled to a machine or station
- Decorated
- Quality checked and packed
- Dispatched or collected
Rename them to suit your work. A sign shop might replace “decorated” with “printed and laminated” and add “fabricated” and “installed”.
What each row records
Use one row per order per stage. Keep it on paper by each station or in a shared sheet, whichever your team will actually fill in.
| Column | What to write |
|---|---|
| Order and stage | Order number and the stage it is waiting for |
| Time in | When the order arrived at this stage |
| Time started | When someone first actually worked on it |
| Time out | When it moved on to the next stage |
| Touch time | Rough hands-on time spent |
| Wait time | Time in to time started, plus any pauses |
| Wait reason | Customer, art, stock, payment, machine or people |
| Owner | The one person responsible for moving it on |
The wait reason matters as much as the hours. A late proof approval and an off-sick digitiser look the same on a timeline, but they need very different fixes.
Rules that keep the log honest
- Add each timestamp when the change happens. Filling the log in from memory on Friday afternoon produces neat, wrong numbers.
- Pick an ordinary week. A single rush order or a bank holiday week will skew everything.
- Cover enough orders, roughly 10 to 20, that one strange job does not dominate.
- Give every handoff a named owner. If nobody owns “waiting on proof reply”, the log will show it, and so will your lead times.
Worked example: one embroidered polo order
Every figure in this example is illustrative, not a benchmark. A corporate client orders 150 embroidered polos with a left-chest logo. Hours are working hours, based on an eight-hour day.
| Stage the order is waiting for | Wait reason | Wait (h) | Touch (h) |
|---|---|---|---|
| Order entry | People | 3 | 0.5 |
| Usable vector logo | Customer | 14 | 0.25 |
| Digitising and proof | Art | 6 | 1.5 |
| Proof approval | Customer | 32 | 0.25 |
| Stock delivery | Stock | 16 | 0.5 |
| Machine slot | Machine | 8 | 0 |
| Embroidery run | Running | 0 | 5 |
| Quality check and pack | People | 4 | 1.5 |
| Dispatch | People | 3 | 0.25 |
| Total | 86 | 9.75 |
Worked example
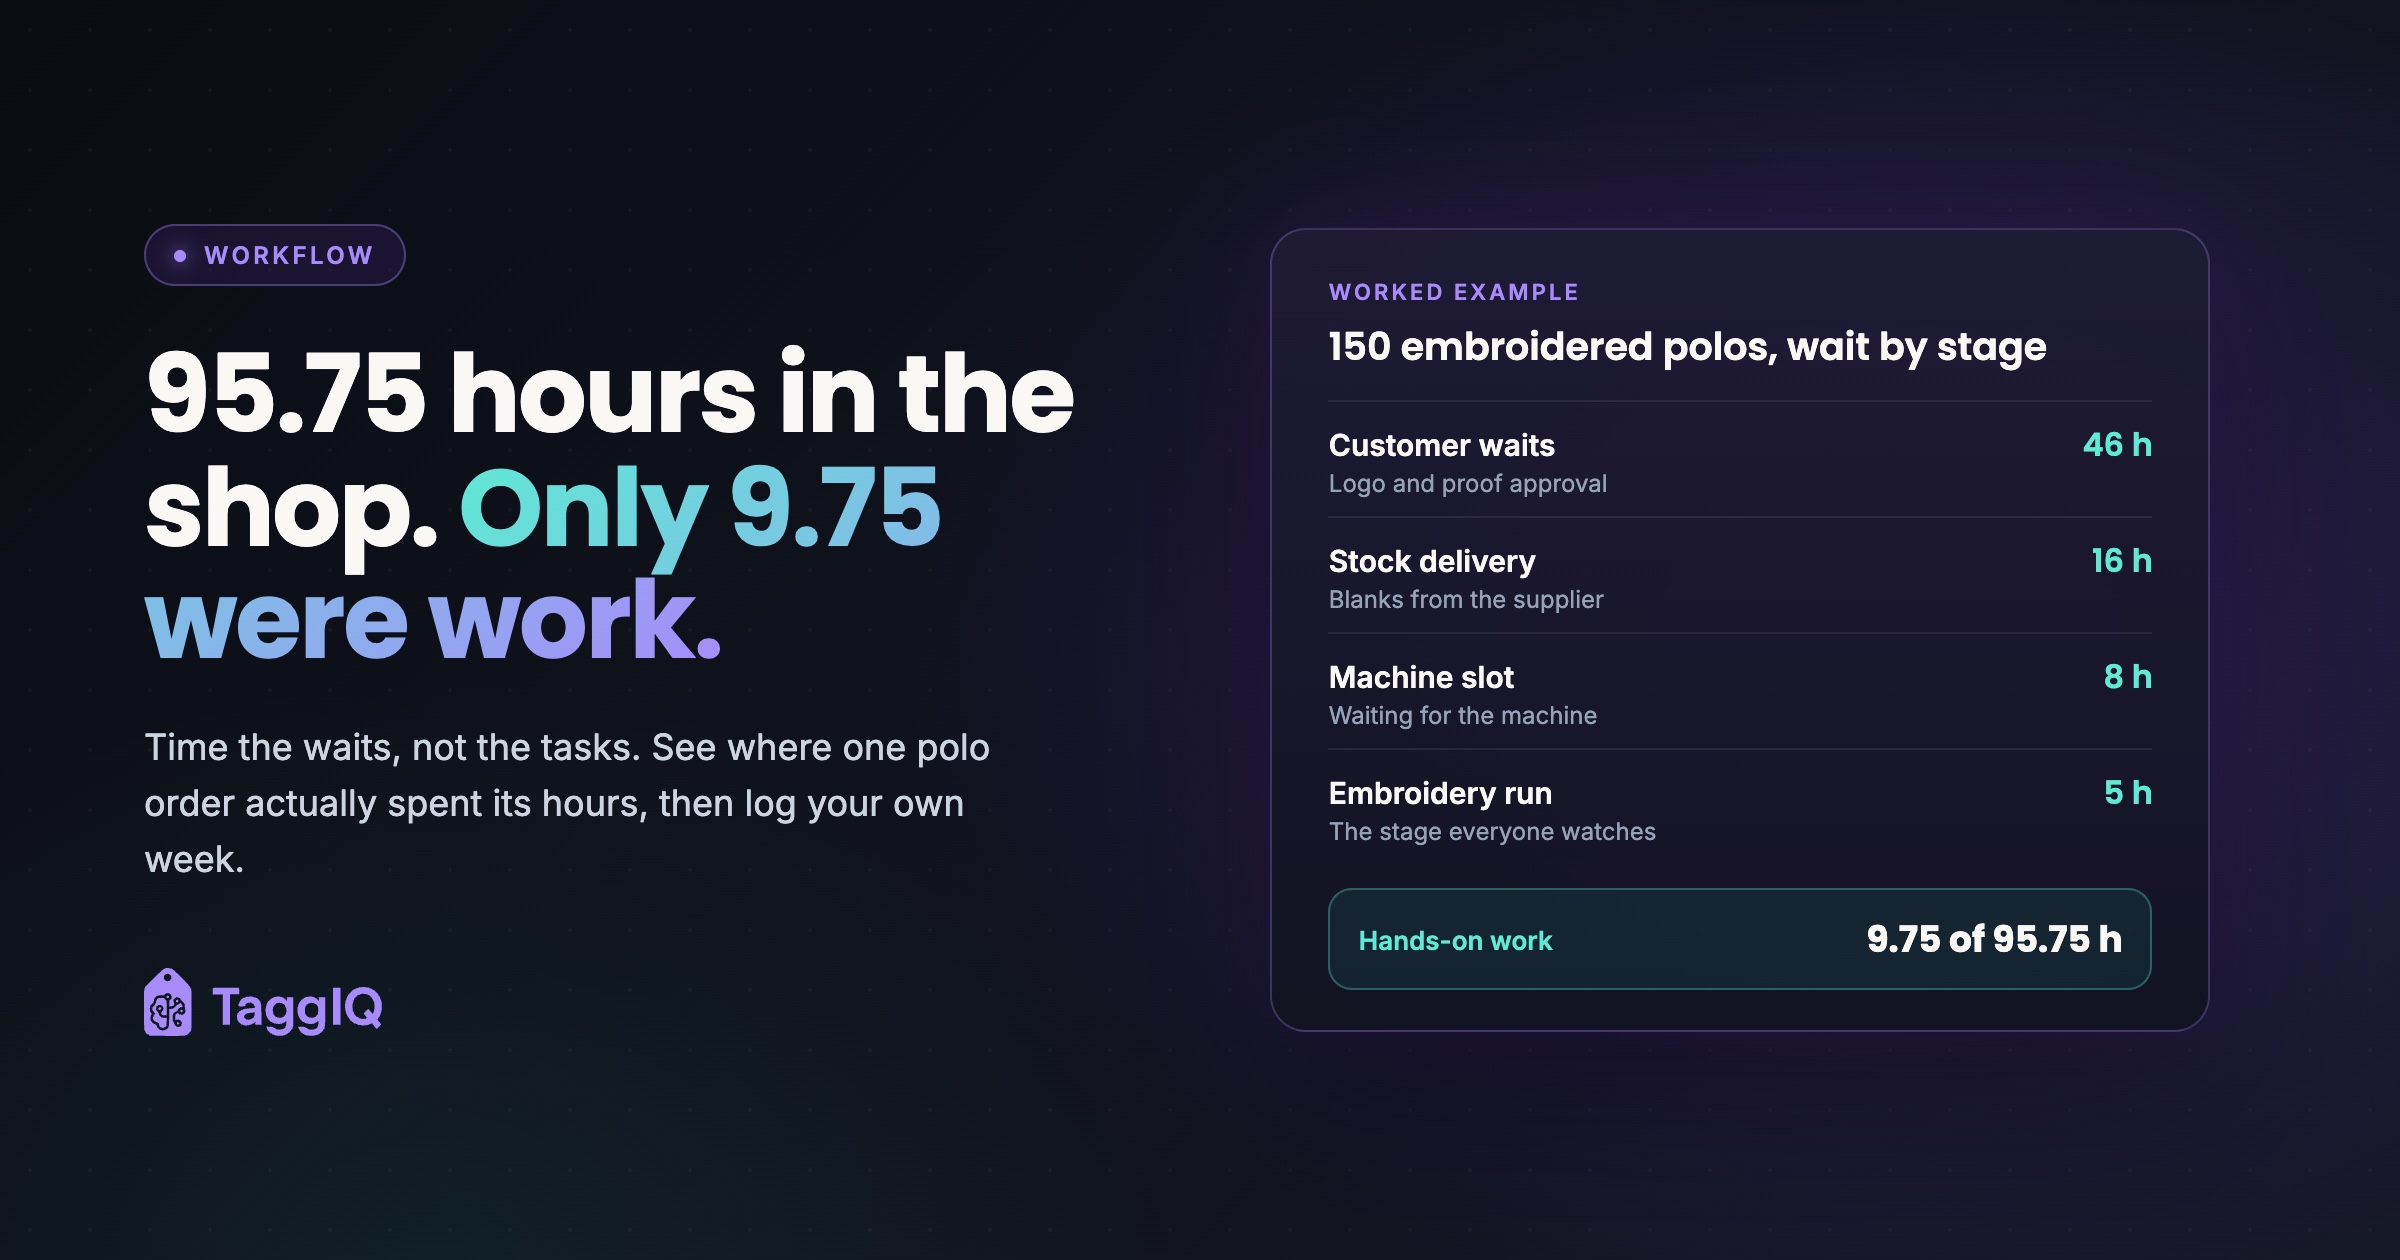
All figures are illustrative. The order spent 95.75 working hours, about 12 working days, in the shop. Only 9.75 of those hours were hands-on work, roughly 10 percent. The embroidery run, the stage everyone watches, accounts for 5 hours of work and 8 hours of waiting. The customer waits, for the logo and the proof, add up to 46 hours. That is more than half of all the waiting.
Look at the order of events too. Stock was not ordered until the proof was approved, so 16 hours of supplier wait came after 32 hours of approval wait instead of running alongside it. That sequence is worth questioning in your own shop. Ordering blanks early has its own risk, though, if the customer changes sizes or cancels.
Read the week, not one order
One order tells a story. A week of orders tells you where to act. At the end of the week, total the wait hours by stage and count how many orders waited there.
The totals below are illustrative, from an imagined week of 14 orders.
| Stage waited in front of | Total wait (h) | Orders affected |
|---|---|---|
| Proof approval | 168 | 11 |
| Stock delivery | 112 | 9 |
| Usable artwork from customer | 84 | 6 |
| Machine slot | 70 | 14 |
| Order entry, quality check and dispatch combined | 56 | 14 |
| Total | 490 |
Worked example
All figures are illustrative. Proof approval holds about a third of all the waiting (168 of 490 hours). Every order passes through the machine slot, which is why it feels like the problem, but on average each order waited there for 5 hours.
The decision rule: the bottleneck is the stage with the largest total wait in front of it over a typical week. If two stages are close, pick the one that affects more orders, because fixing it helps more customers. Then read the wait reasons for that stage to choose your fix.
A quick sense check with Little’s Law
John Little published a proof of the queuing formula L = λW in the journal Operations Research in 1961 (retrospective via RePEc). It links the average number of items in a system to the rate they come through and the average time each one spends inside. In shop terms: open jobs divided by jobs completed per day gives a rough average of days in the shop.
Worked example
Illustrative figures. You have 36 open orders on the board and finish about 4 per working day. 36 divided by 4 gives about 9 working days in the shop on average. If your log says orders take 3 days, one of the two numbers is wrong, and it is worth finding out which. If you cut open orders to 28 by holding back work that is not ready, while still finishing 4 a day, the average falls to 7 days.
Treat it as a rough check on your log, not a forecast. It works best on averages over a period when your workload is fairly steady.
The three usual culprits
These are not benchmarks. They are the three places to look first, and your log will show whether they apply to you.
1. Waiting on the customer
Production cannot start without a usable vector logo, a signed-off proof, a size breakdown for apparel, a deposit and delivery details. Each one is a separate chase, and often none of them has an owner.
Ask for everything at the point of order in one message. Give one person ownership of each open item, and chase on a fixed schedule instead of whenever someone remembers. Artwork approvals over email cause enough trouble to need their own fix, so start there if proof approval tops your log.
2. Waiting on stock
Blanks get ordered late, deliveries arrive split, or cartons arrive and nobody books them in, so the job looks stuck while the goods sit in the back room. Record the time goods were booked in separately from the delivery date the supplier promised. The log will then show whether the wait is the supplier’s lead time or your own receiving.
3. Jobs released to production incomplete
A job goes to the floor because the customer is chasing, then stalls because the sizes have not arrived or one colourway is short. It sits half-started, blocks a slot and shows up as a production problem. The cure is a “ready to run” gate: a job only enters the production queue once art approval, sizes, stock, payment and delivery details are confirmed. Some shops check this in a short daily production meeting. The free Production Handoff Checklist lists the fields to check before a job crosses that line.
Fix one thing, then measure again
The Theory of Constraints Institute’s five steps work as a loop for a decorated-goods shop:
| Step | What it means in your shop |
|---|---|
| Identify the constraint | Use the log. Name the one stage with the largest total wait. |
| Exploit the constraint | Get more from it without spending money: send proofs the same day, chase on a schedule, make approval a one-word reply. |
| Subordinate everything else | Make other stages serve it: collect sizes and delivery details at order so that approval is the last open item. |
| Elevate the constraint | Only now add people, tools or money, if the first two steps were not enough. |
| Prevent inertia | Run the log again. The constraint usually moves, and it may now be stock or the machine. |
Change one thing at a time, then run the log for another week and compare stage totals. If you change three things at once, you will not know which one worked. Do not count on a particular gain. Let the second week’s numbers tell you.
What a wrong diagnosis costs
Jobs waiting between stages tie up cash. The garments may already be bought and the deposit taken, while the invoice waits until dispatch. Long, unpredictable lead times put event and deadline orders at risk, which leads to overtime, express couriers or a customer who does not come back. Staff lose hours chasing and answering “where is my order” calls, which adds nothing to the job. And buying a machine for a stage that is not the constraint does not shorten lead time.
If those calls are hard to answer because the order history lives in someone’s head, fix customer context across your team alongside the log.
Your next step this week
Pick next week. Print the log and put a sheet at each station, or add the columns to your existing tracker. Name one person to check it each afternoon. On Friday, total the wait hours by stage, apply the decision rule and choose one change for the following week.
If you want the handoff fields in one place, the Production Handoff Checklist can be downloaded in PDF and Excel. In the TaggIQ platform, the quote, order, proof, purchase order, size collection and invoice stay connected. Readiness is checked on the order, and each blocked item shows an owner and a next step. You still run the one-week log by hand.
If your log points at customer chasing, TaggIQ is also scoping a Production Agent. It is a proposed build, not a packaged feature you can switch on today. The idea is that it would check jobs for missing items and chase vector logos, size breakdowns, proof approvals, delivery details and deposits on a schedule you approve, then hand back to your team. It is scoped after a platform demo.
See the proposed agent Read what the proposed Production Agent would chase for your shop and book a guided demo to see whether it fits.
Frequently asked questions
Some stages overlap. How do I log an order when stock is ordered while the proof is still out?
Log each stage with its own time in and time out, and total the waits per stage as normal for the bottleneck tally. For the order's lead time, measure from order confirmed to dispatched rather than adding up stage waits. That way overlapping time is not counted twice.
My customers are the bottleneck. Can I really fix something I do not control?
You control how and when you ask. Request every item in one message at the point of order, make approval a one-word reply, chase on a fixed schedule with a named owner, and consider quoting your lead time from approval and receipt of everything you need rather than from the order date. Then the customer can see their part of the wait too.
Should I track machine utilisation instead?
Utilisation tells you how busy a machine is, not how long orders waited to reach it. A machine can be busy in bursts and still not be the constraint if work arrives late or incomplete. Run the wait log first. Utilisation becomes useful once the log points at production.
How often should I repeat the log?
Run it again for a week after each change to the constraint, because the bottleneck usually moves. After that, repeat it whenever lead times start to drift or before any big spend on equipment or staff.

Dave
Dave writes for TaggIQ about running a profitable print, promo, sign and embroidery business: costing and estimating, margins, production flow, order workflows, pricing decisions and keeping customers coming back.