In this article 10 sections
- Why more orders can mean less profit
- The better measure: contribution per bottleneck hour
- Find your bottleneck before you measure anything
- Three jobs, ranked three ways
- Use the ranking when the queue is full
- Your break-even contribution per hour
- Fixing the bottom third
- A decision rule for each bottom-third job
- Price the time nobody quoted
- Run it on last month's jobs this week
You have more orders than last year. The press runs late most nights, the art desk has a queue and the schedule board in your print shop is full. But when the month closes, the bank balance looks much the same as it did when the shop was quieter.
Here is the short answer. You are not really selling orders. You are selling hours on the busiest part of your shop, and some jobs pay far more for those hours than others. A small job with several print locations can show a better margin percentage than a big, simple run and still earn a fraction as much per hour of press time. Measure every job by contribution per bottleneck hour and the jobs eating your growth stand out straight away.
Why more orders can mean less profit
Most shops judge a job by what it is worth as an order: the revenue, or the margin percentage on the quote. Neither one looks at time.
Setup is the problem. Burning screens, outputting film, registering, digitizing, hooping, threading, preparing files and sending proofs all take shop time before the first piece is finished. That preparation can be similar for a small run and a much larger one, so a short order can consume a disproportionate share of the bottleneck. Price that work with a setup fee, a small-order rate or a minimum that fits the customers you serve.
So when your growth comes mostly from small jobs, every new order brings a full setup with it. Order count goes up, revenue goes up, and your capacity disappears into changeovers.
The better measure: contribution per bottleneck hour
This method borrows two ideas from management accounting.
Contribution is a job’s price minus its variable costs, the costs that only exist because you took the job. AccountingTools defines contribution margin as price minus associated variable costs, the incremental profit on each sale. For a decorator, variable costs usually mean blanks, ink or thread, transfers, freight and outsourced work. Wages and rent are left out, because they do not change when you take one more job this week. If a job forces overtime or temp hours, count that extra pay as a variable cost of that job.
The bottleneck is the resource with the least spare time. ACCA’s guide to throughput accounting and the theory of constraints treats labor and variable overheads as largely fixed in the short term. It divides each product’s throughput by the time it spends on the bottleneck, then ranks products by that return per bottleneck hour and gives out bottleneck time in that order. In ACCA’s own worked example, the product with the highest throughput per unit was not the one to put first.
ACCA’s throughput takes off material cost only. The version below also takes off freight and outsourced decoration, because those costs also scale with each job. The logic is the same.
Find your bottleneck before you measure anything
Depending on your shop, the bottleneck might be the automatic press, the heads on your embroidery machine, the art and digitizing desk, the wide-format printer, or the finishing or install crew. To find it, ask two questions. Where does work sit waiting? And if you got one extra hour on one resource, which would let you ship more work this week?
Measure hours on that resource only. An hour lost on a machine that sits half idle costs you very little. An hour lost at the bottleneck is an hour you cannot sell to anyone else.
Three jobs, ranked three ways
Here the bottleneck is an automatic screen press. Hours mean press time: setup and teardown plus run time.
Worked example
All figures are illustrative.
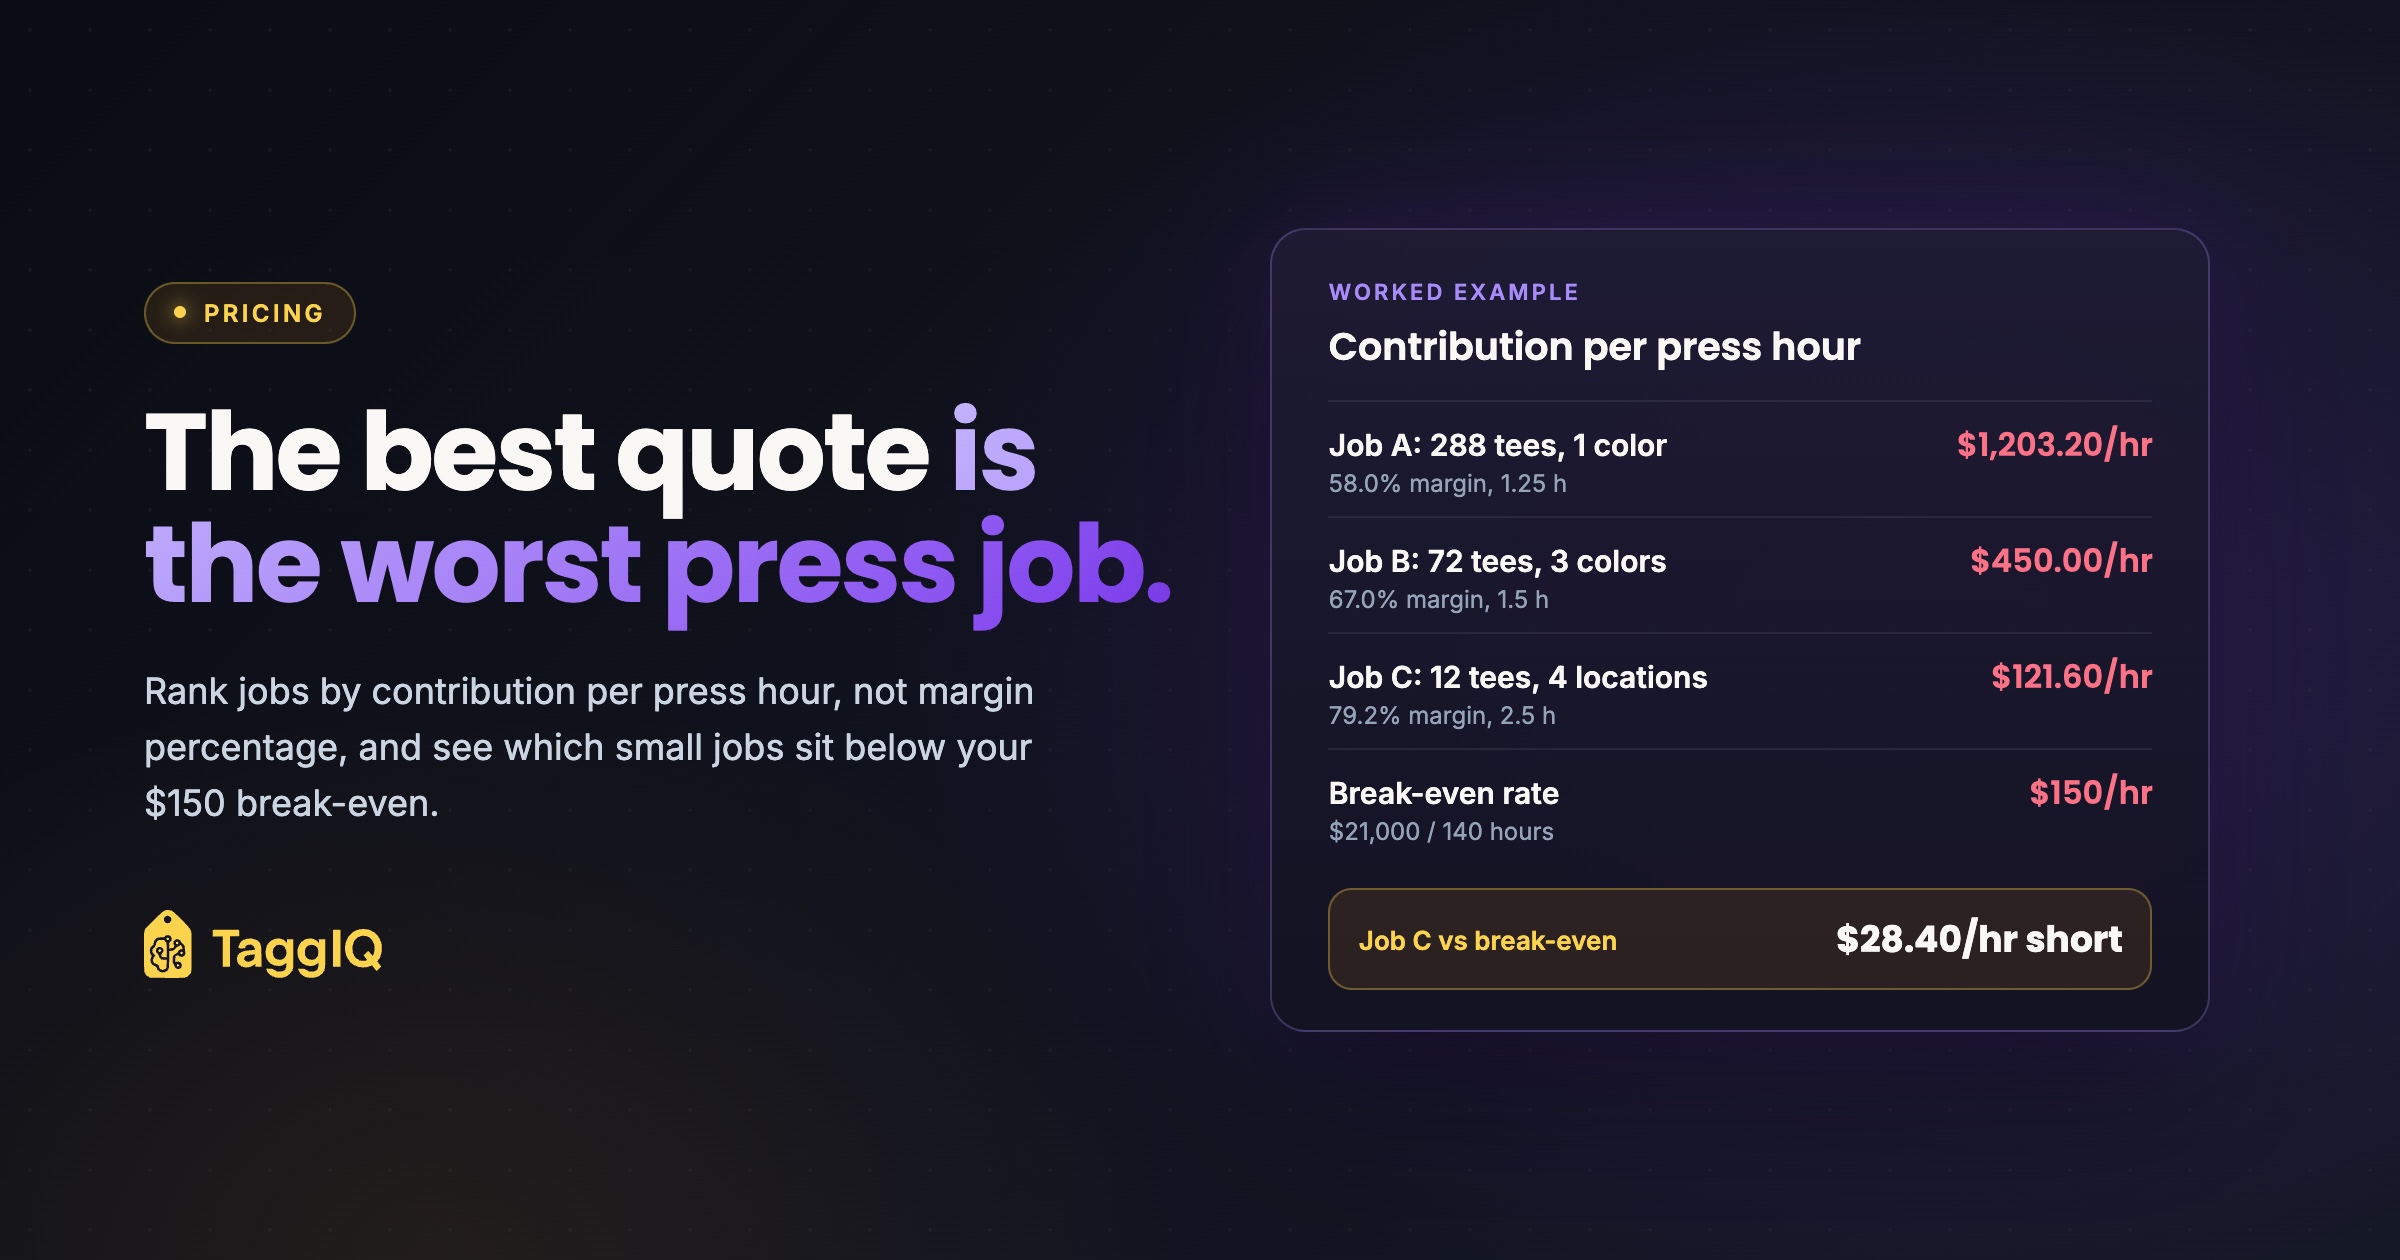
Job A: 288 tees, 1 color, 1 location. $9.00 each, so revenue is $2,592. Blanks cost $1,008 ($3.50 each) and ink, screens and freight $80. Contribution is $1,504, a 58.0% margin. Press time is 0.5 h setup and teardown plus 0.75 h run, 1.25 h in total. Contribution per press hour: $1,203.20.
Job B: 72 tees, 3 colors, front. $14.00 each, so revenue is $1,008. Blanks cost $288 ($4.00 each) and ink, screens and freight $45. Contribution is $675, a 67.0% margin. Press time is 1.25 h setup and teardown plus 0.25 h run, 1.5 h in total. Contribution per press hour: $450.00.
Job C: 12 tees, 4 locations. $32.00 each, so revenue is $384. Blanks cost $60 ($5.00 each) and ink, screens and freight $20. Contribution is $304, a 79.2% margin. Press time is 2.0 h setup and teardown (4 x 0.5 h) plus 0.5 h run, 2.5 h in total. Contribution per press hour: $121.60.
Ranked by margin percentage: C, then B, then A. Ranked by contribution per press hour: A, then B, then C.
On the quote, Job C looks like the best job: the highest price per piece and nearly 80% margin. On the press, it is the worst by a wide margin. It took 2.5 hours to earn $304. Job A earned $1,504 in half that time.
The job that looks best on the quote can be the one doing the least for your press.
Use the ranking when the queue is full
Before changing a minimum, check the schedule against the bottleneck hours you can actually sell. If scheduled work leaves spare hours, a positive-contribution job can help. When work fills or exceeds that capacity, rank the queue by contribution per bottleneck hour and protect the jobs that earn more for each scarce hour.
If the press would otherwise sit idle, a low-yield job like Job C still adds contribution. The ranking matters when the schedule is full, due dates are slipping or overtime is becoming routine: every low-yield bottleneck hour can displace work that earns more. Recheck the bottleneck when the pattern changes; an art-desk backlog calls for art hours in the denominator, even if the press has room.
Your break-even contribution per hour
To know where “too low” begins, work out what each bottleneck hour has to earn to cover the shop’s fixed costs.
Worked example
Illustrative figures for a small screen shop.
- Monthly labor and overhead (wages, rent, utilities, insurance, software, loan interest): $21,000
- Sellable press hours: 20 working days x 7 productive hours = 140 hours
- Break-even contribution per press hour: $21,000 / 140 = $150
Job C earns $121.60 per press hour, which is $28.40 below break-even. If every press hour earned what Job C earns, the month would bring in 140 x $121.60 = $17,024 of contribution against $21,000 of fixed costs, a shortfall of $3,976.
Use realistic hours. Leave out cleaning, maintenance and the hours you never manage to fill. If your press really sells fewer hours than you planned for, your break-even rate is higher than you think.
If some of your contribution comes from work that never touches this bottleneck, such as embroidery on separate machines or resold goods with no decoration, subtract that monthly contribution from fixed costs before you divide by bottleneck hours. Otherwise the press carries costs that other work already covers, and your break-even rate comes out too high.
Keep overhead in this one per-hour number. Do not spread it across each job’s cost when you compare jobs. Loaded overhead makes every job look roughly equally marginal and hides the real difference, which is how much each job earns for the time it takes. Shop profit comes from the average across all bottleneck hours beating break-even. Jobs above the line carry the jobs below it.
Fixing the bottom third
Once you have ranked a month of jobs, look at the bottom third. Declining them is the last option, not the first. Here is Job C again under each fix.
Worked example
Job C fixes, all figures illustrative. Break-even is $150 per press hour. With a target of $4,200 profit a month, the target rate is ($21,000 + $4,200) / 140 = $180 per press hour.
As quoted: $304 contribution over 2.5 press hours, $121.60 per press hour.
Add a $25 setup fee per location ($100): $404 over 2.5 hours, $161.60 per press hour.
Raise the minimum to 24 pieces at $26: revenue $624, variable costs $150 (blanks $120 at $5.00 each, ink, screens and freight $30), contribution $474 over 3.0 hours, $158.00 per press hour.
24-piece minimum plus setup fees: $574 over 3.0 hours, $191.33 per press hour.
Batch with similar jobs, cutting setup from 2.0 h to 1.25 h: $304 over 1.75 hours, $173.71 per press hour.
Standardize to 2 locations at $22: revenue $264, variable costs $75 (blanks $60, ink, screens and freight $15), contribution $189 over 1.0 h setup plus 0.25 h run, 1.25 hours, $151.20 per press hour.
Every fix clears the $150 break-even. Only the 24-piece minimum plus setup fees clears the $180 target.
Every fix lifts Job C above break-even, but break-even is the floor, not the target. Clearing it only means the job covers its share of fixed costs. Set a target rate as (monthly fixed costs + the monthly profit you want) / sellable bottleneck hours, and judge each fix against that. Combining a minimum with setup fees works best, because it charges for the setup and spreads it over more pieces at the same time. Where a customer genuinely needs only a dozen pieces, a setup fee or a flat small-order rate covers the setup without asking them to buy more.
A decision rule for each bottom-third job
Work through these in order, combining them where needed, until the job clears your target rate:
- Charge for the setup you already do. Screen, digitizing or location fees that are on the job ticket.
- Set a minimum or a flat small-order rate so setup is spread over enough pieces.
- Batch small jobs that share ink colors, thread, pallets or hoop sizes into one scheduled block.
- Standardize by offering stock layouts, fewer locations or catalog designs that need no new art.
- Reprice the per-piece rate for that job type in your price list.
- Decline or refer, but only after you have looked at the whole customer relationship.
The last check matters. A loyal customer who sends small reorders and also a couple of large event orders a year is worth more than their small jobs suggest. Rank by customer as well as by job before you change terms.
Price the time nobody quoted
Small jobs often run over in places the quote never covered: rush changes to the schedule, a third proof round, or receiving and counting customer-supplied garments. If the art desk is your bottleneck, proof rounds are bottleneck hours and belong in the calculation. Either add that time to the job’s hours or put a line on the quote for it. The breakdown of hidden margins in setup and run charges shows how to structure those fees, and the pricing guide covers setting the per-piece price underneath them.
Run it on last month’s jobs this week
You can do this in a spreadsheet in an afternoon, or check a single job first with the profit margin calculator:
- Export last month’s completed jobs with revenue and direct costs.
- Add a column for bottleneck hours: setup and teardown plus run time. Estimate from setup counts and run rates if you have no log.
- Calculate contribution, then contribution per bottleneck hour.
- Sort from highest to lowest and mark the bottom third.
- Group the bottom third by job type, decoration method and customer, and look for patterns.
- Work through the decision rule for each pattern rather than each job.
For the next four weeks, write down actual setup and run hours next to your estimates. Comparing estimates with actuals shows which job types always run long, and those are usually the ones priced too low.
If you use TaggIQ, its order margin reporting already shows gross margin on every order by product category, decoration method and customer, and it exports to CSV. Its margins are built from blanks, decoration and shipping costs, so add the bottleneck hours from your own production log to the export.
Check a job's margin Use the profit margin calculator on one job's variable costs (blanks, ink, freight, outsourced work) and leave labor out, then subtract those costs from your price and divide the result by the job's bottleneck hours to compare it with your target rate.
Frequently asked questions
I have never tracked press hours. Can I still do this?
Yes. For one month, estimate hours from the number of setups and your usual run rate per job type. Rough numbers are enough to show the ranking. Then log actual hours for a few weeks so the estimates improve and you can see which jobs regularly run over.
Does this mean I should stop taking small orders?
No. When your bottleneck has spare time, any job with positive contribution adds profit. Small orders also bring in customers who later place larger ones. The goal is to price and schedule small work so it clears your break-even rate when capacity is tight, not to turn it away.
My bottleneck switches between the press and the art desk. Which do I measure?
Track both columns for a month and rank by whichever was tighter that month. Jobs heavy on art, such as new logos, new digitizing or several proof rounds, often look fine on press hours and poor on art hours. That usually points to an art or digitizing fee rather than a higher per-piece price.
How often should I redo the ranking?
Monthly works well while you are making changes, then quarterly once your fees and minimums settle. Review by job type and by customer each time, because a change in your mix of work can move your bottom third without any single job looking unusual.

Dave
Dave writes for TaggIQ about running a profitable print, promo, sign and embroidery business: costing and estimating, margins, production flow, order workflows, pricing decisions and keeping customers coming back.