In this article 10 sections
You set most prices in your print, sign or apparel shop by feel. Meanwhile a year of job history sits in your system showing which prices win, which jobs make money and which ones quietly lose it.
The short answer: export your last 12 months of quotes and jobs, and run three analyses. Check win rate by margin band, margin by job type, and estimated versus actual cost. Each gives you a decision: raise, hold or re-cost.
Start with one clean export
Pull the file from whatever you use today: shop software, an accounting tool or your quote spreadsheet.
You need one row per quote with these columns:
- Quote date
- Customer
- Job type or decoration method (screen print, embroidery, DTF, signs, promo)
- Quantity
- Quoted price
- Won or lost
- Estimated cost
- Actual cost, for won jobs
First, keep the lost quotes. Without them you cannot calculate a win rate, and the first analysis is impossible. Leave out quotes with no decision yet, so open quotes are not counted as lost.
Second, actual cost has to be complete. Include blanks, decoration time, setup, screens, digitizing, artwork time, reprints and shipping. Leave out setup and reprints and small runs will look far more profitable than they are.
Add one calculated column: margin, which is quoted price minus estimated cost, divided by quoted price. Use this estimated margin for the win-rate analysis, and actual margin on won jobs for the job-type and quantity analyses.

Signal one: win rate by margin band
A high overall win rate can feel like success when it really means your prices are too low. What you want to see is where a higher price starts to cost you work.
Compare like with like. Run the bands within one job type, quantity tier and customer type, with similar scope. A high margin can come from a lower cost or a different job mix, not a higher price. Treat what you find as a candidate for a price test, not proof.
Sort your quotes into margin bands and count wins in each.
Worked example
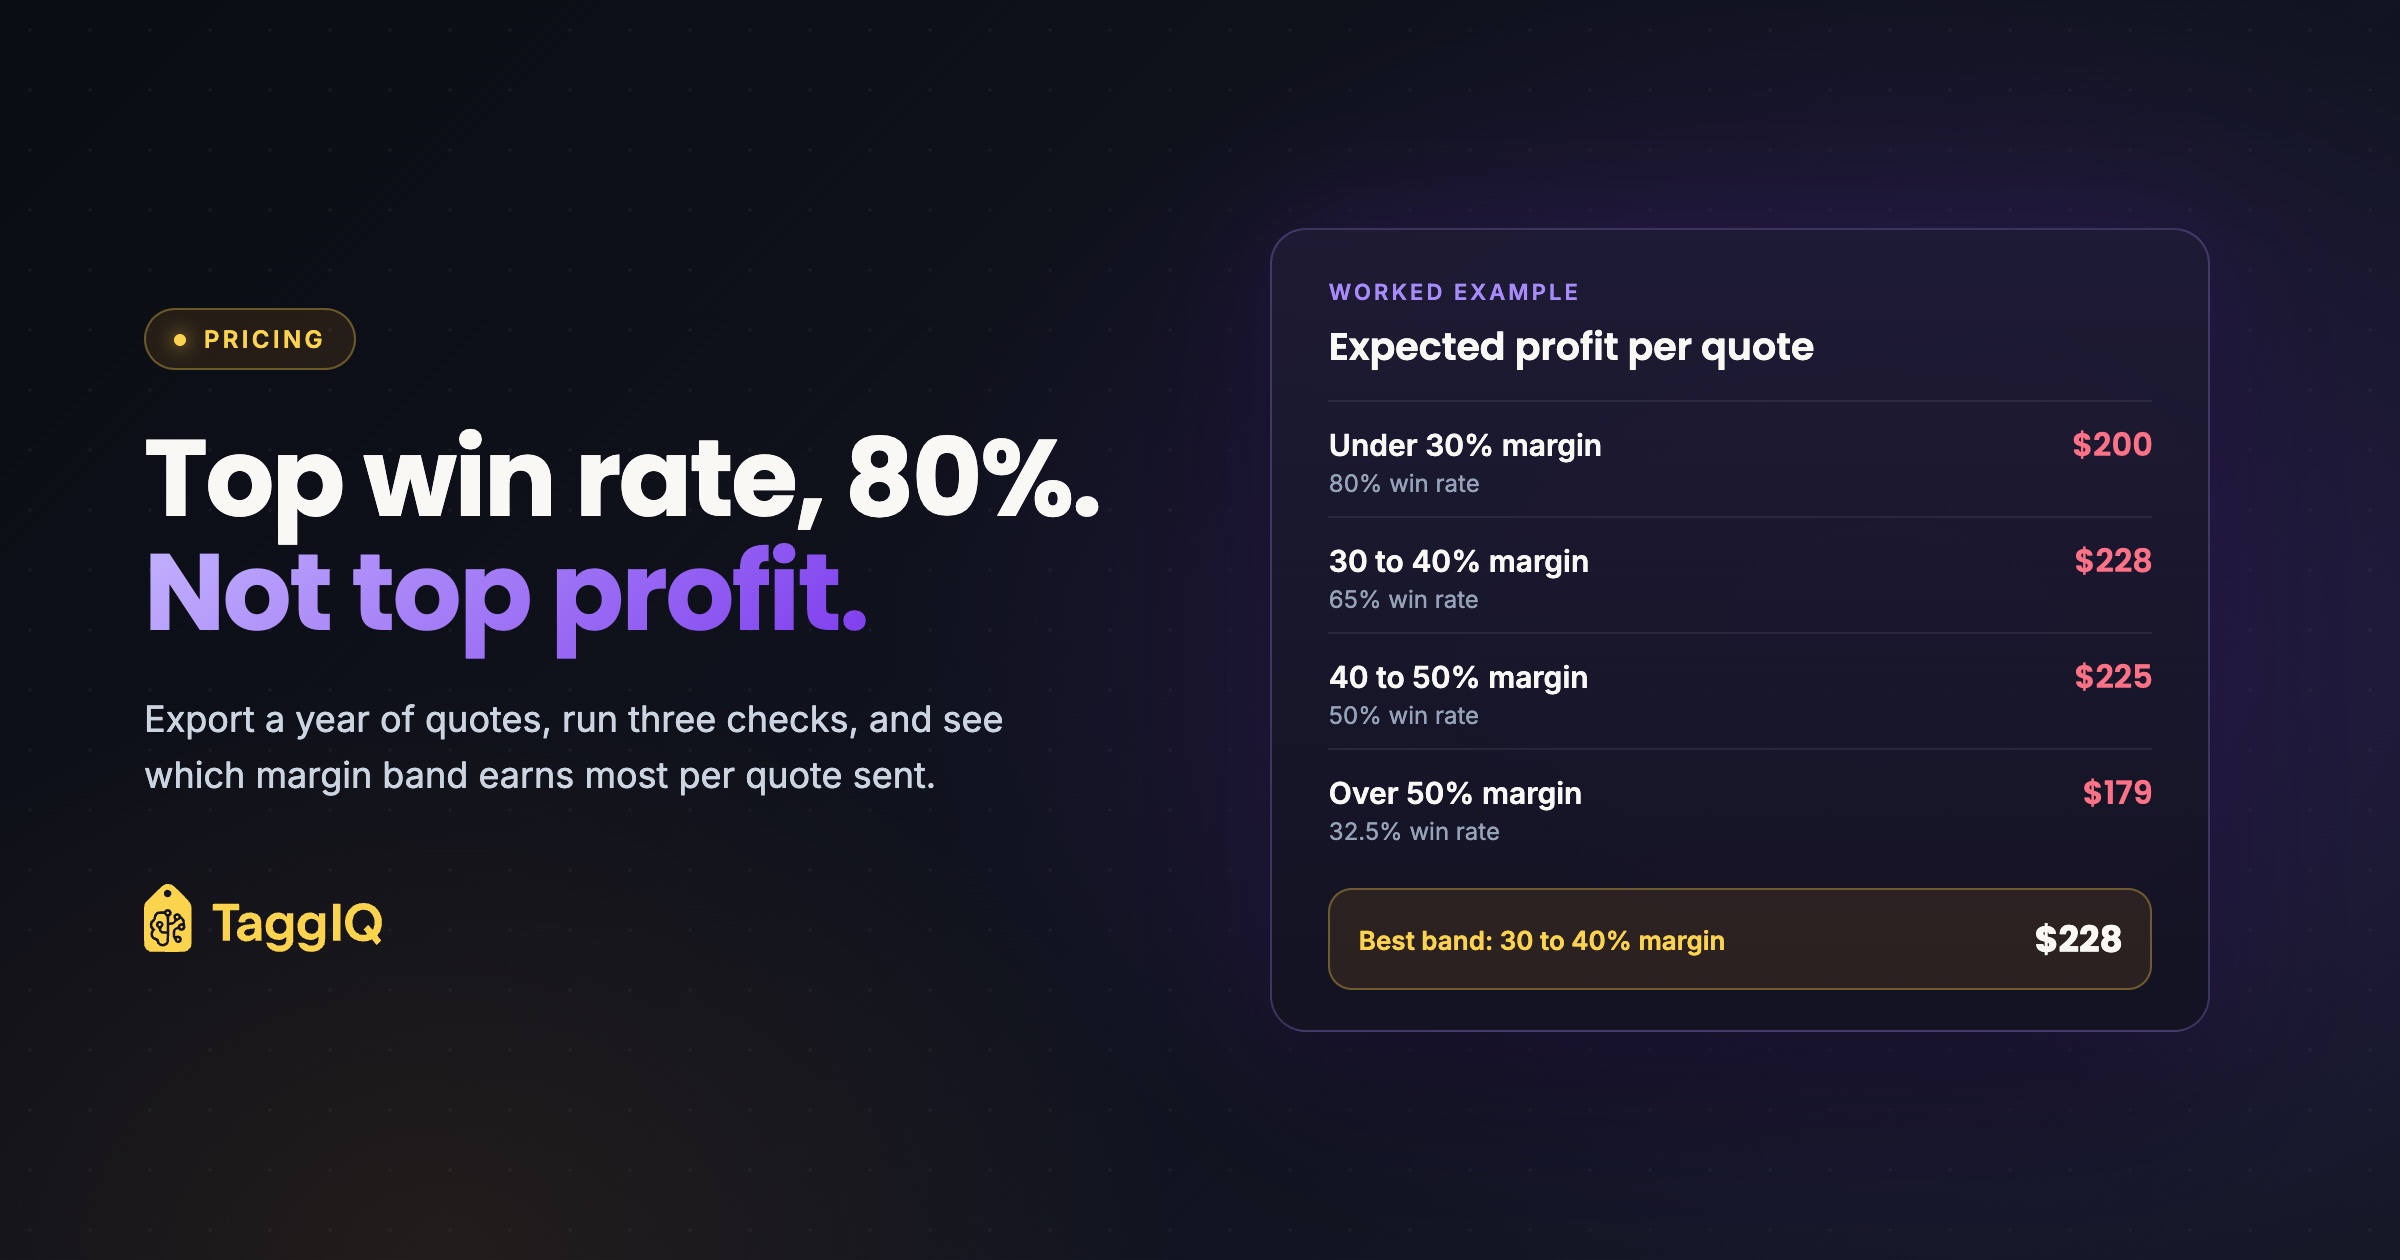
A shop has 12 months of data: 400 quotes, 250 won, an overall win rate of 62.5%. Split by margin band, each line ends with expected gross profit per quote: win rate x gross profit per won quote.
- Under 30% (avg 25%): 120 quotes, 96 won, 80% win rate. 80% x $250 = $200
- 30 to 40% (avg 35%): 140 quotes, 91 won, 65% win rate. 65% x $350 = $228
- 40 to 50% (avg 45%): 100 quotes, 50 won, 50% win rate. 50% x $450 = $225
- Over 50% (avg 55%): 40 quotes, 13 won, 32.5% win rate. 32.5% x $550 = $179
The low band wins most often but earns less per quote sent than either middle band. Every band clears the rough sample threshold below, though the top band has the fewest quotes. This simplified version pools job types and assumes every quote is $1,000 at its band’s average margin. Figures are rounded to the nearest dollar.
The number that matters is expected gross profit per quote: total gross profit on the won quotes in a band, divided by all quotes sent in that band. Estimated costs give you estimated gross profit; actual costs on won jobs give you realized gross profit. A band with a high win rate and thin margins can earn less per quote than one that wins less at a healthier margin.
The discount check
The same logic tells you whether a discount pays for itself. Work out how much more often you would need to win to make up the margin you give away.
Worked example
A $1,000 job at a 30% margin earns $300 gross profit. Cut the price 10% to $900 and the cost stays $700, so profit drops to $200.
You now need 1.5 times as many wins to earn the same. If you win this kind of job 40% of the time at full price, the discount only breaks even if it lifts your win rate to 60%. Expected profit at full price: 40% x $300 = $120. At the discount: 60% x $200 = $120.
Watch the sample size
As a rough rule of thumb, not a statistical standard, treat any band with fewer than about 20 to 30 quotes as too thin to judge. If every quote you sent last year sat in one narrow margin range, the data cannot tell you what happens at a higher margin. In that case, the next step is a deliberate test, covered below.
Signal two: margin by job type and quantity
An average across the whole shop hides problems. A profitable category can carry a loss-making one, and the total looks fine.
Filter your won jobs by job type and add up revenue and gross profit for each.
Worked example
The same shop’s 250 won jobs, by job type:
- Screen print: 90 jobs, $108,000 revenue, $43,200 gross profit, 40% margin
- Embroidery: 70 jobs, $63,000 revenue, $28,350 gross profit, 45% margin
- Signs: 40 jobs, $54,000 revenue, $18,900 gross profit, 35% margin
- DTF transfers: 50 jobs, $25,000 revenue, $5,000 gross profit, 20% margin
- Total: 250 jobs, $250,000 revenue, $95,450 gross profit, 38% margin (rounded)
A 38% shop-wide margin looks healthy. DTF at 20% is the problem the average was hiding.
Split again by quantity tier
Now break each job type into quantity tiers, for example under 24 pieces, 24 to 71, and 72 and up. Setup, screens, digitizing and artwork time are spread over fewer pieces on short runs, so this is where margins tend to fall apart.
Worked example
Embroidery averages 45%, but by tier: orders under 24 pieces run at 22%, while 72 pieces and up run at 50%. The fix is a minimum charge or a higher short-run price, not a price rise on every embroidery job.
If short runs are the issue, the guide on setting minimum order quantities so small jobs still pay walks through the numbers for a minimum charge.
Signal three: estimated versus actual cost
Compare the cost you assumed when quoting with what the job really cost.
Add a variance column: actual cost minus estimated cost, divided by estimated cost. Then flag any job that runs further over estimate than a threshold you choose. Keep that threshold the same each review so quarters compare.
Worked example
This shop flags any job more than 10% over estimate. A 24-piece DTF order is quoted at $500 with an estimated cost of $380, a 24% margin.
Actual cost:
- Blanks: $210
- Transfers: $90
- Press time: $60
- Artwork, 30 minutes: $30
- Reprint of 3 shirts: $25
- Shipping: $20
- Total: $435
That is $55 over estimate, or 14.5%, so it gets flagged. The real margin was 13%, not 24%. The artwork time and the reprint were never in the estimate.
Then count flags by job type. If a large share of one job type’s jobs are flagged, the problem is the estimate, not bad luck. Look at which cost line keeps running over. Reprints are a separate fix, and the piece on stopping remakes and deciding who pays covers that side.
Turn the signals into decisions
Each signal leads to one of a few actions. Use this table as your decision rule.
| What the data shows | Action | What to do |
|---|---|---|
| Win rate holds as margin rises within comparable jobs | Test a raise | Quote one band higher on that job type for a set period |
| Win rate falls sharply above a band, expected profit per quote drops | Hold | Keep pricing in the band that earns most per quote |
| Margin is low and actual cost regularly runs over estimate | Re-cost | Fix the estimate first: add the missing setup, artwork or reprint allowance |
| Margin is low but costs match estimate | Raise or set a minimum | The price is wrong, not the costing |
| Too few quotes in a band to judge | Test | Run a deliberate price test on that job type |
Re-cost before you raise. If the estimate is missing $55 of artwork and reprint time, a price rise only papers over it, and you will still misjudge the next quote.
Test on one job type first
Do not raise prices everywhere at once. Pick the one job type the data flags most clearly and change its pricing for a set period, such as one quarter.
Then rerun the same three analyses on that job type alone. Did the win rate hold? Did expected profit per quote go up? If yes, move to the next job type. If not, you have lost little and learned where the ceiling is.
For the customer side of a price change, see raising your prices without losing good customers. For building the price itself from cost, the pricing guide covers the method.
Make it a quarterly habit
Put a quarterly review in the calendar and repeat the same steps:
- Pull a fresh 12-month export, lost quotes included.
- Update win rate and expected profit per quote by margin band.
- Update margin by job type and quantity tier.
- Flag jobs over the cost variance threshold.
- Make one raise, hold or re-cost decision and start one test.
If you would rather not rebuild the export by hand each quarter, TaggIQ’s reporting shows gross margin per order broken down by product category, decoration method and customer, with costs including blank goods, decoration and shipping. It also tracks quote-to-order conversion rate, and reports export to CSV, which gives you a starting file for your own spreadsheet analysis.
See TaggIQ reporting See how margin and conversion reports can feed your quarterly pricing review.
Frequently asked questions
What if my system never recorded lost quotes?
Start recording them today, with the date, job type and quoted price. You can still run the margin and cost analyses now, and add the win rate analysis once you have a quarter or two of lost quotes.
I don't track actual cost per job. Can I still do this?
Pick your two highest-volume job types and cost the next ten jobs of each in full, including setup, artwork time and reprints. That small sample is enough to show whether your estimates run low.
Should I price by margin or by markup for this analysis?
Use margin, meaning profit as a share of the selling price, so the bands compare cleanly with win rate. Whatever you choose, use the same measure in every review so quarters line up.
How do I know a change worked and not just a busy season?
Compare the tested job type against the same quarter last year and against the job types you did not change. If only the tested type moved, that supports further testing, but check whether customer mix, quantities, scope or costs also changed before attributing the result to pricing.

Dave
Dave writes for TaggIQ about running a profitable print, promo, sign and embroidery business: costing and estimating, margins, production flow, order workflows, pricing decisions and keeping customers coming back.