In this article 10 sections
You check the bank balance on Monday morning. If it looks healthy, the business feels healthy. Then a quiet patch arrives and nobody saw it coming, because the money in the account was paid for by work quoted two months earlier.
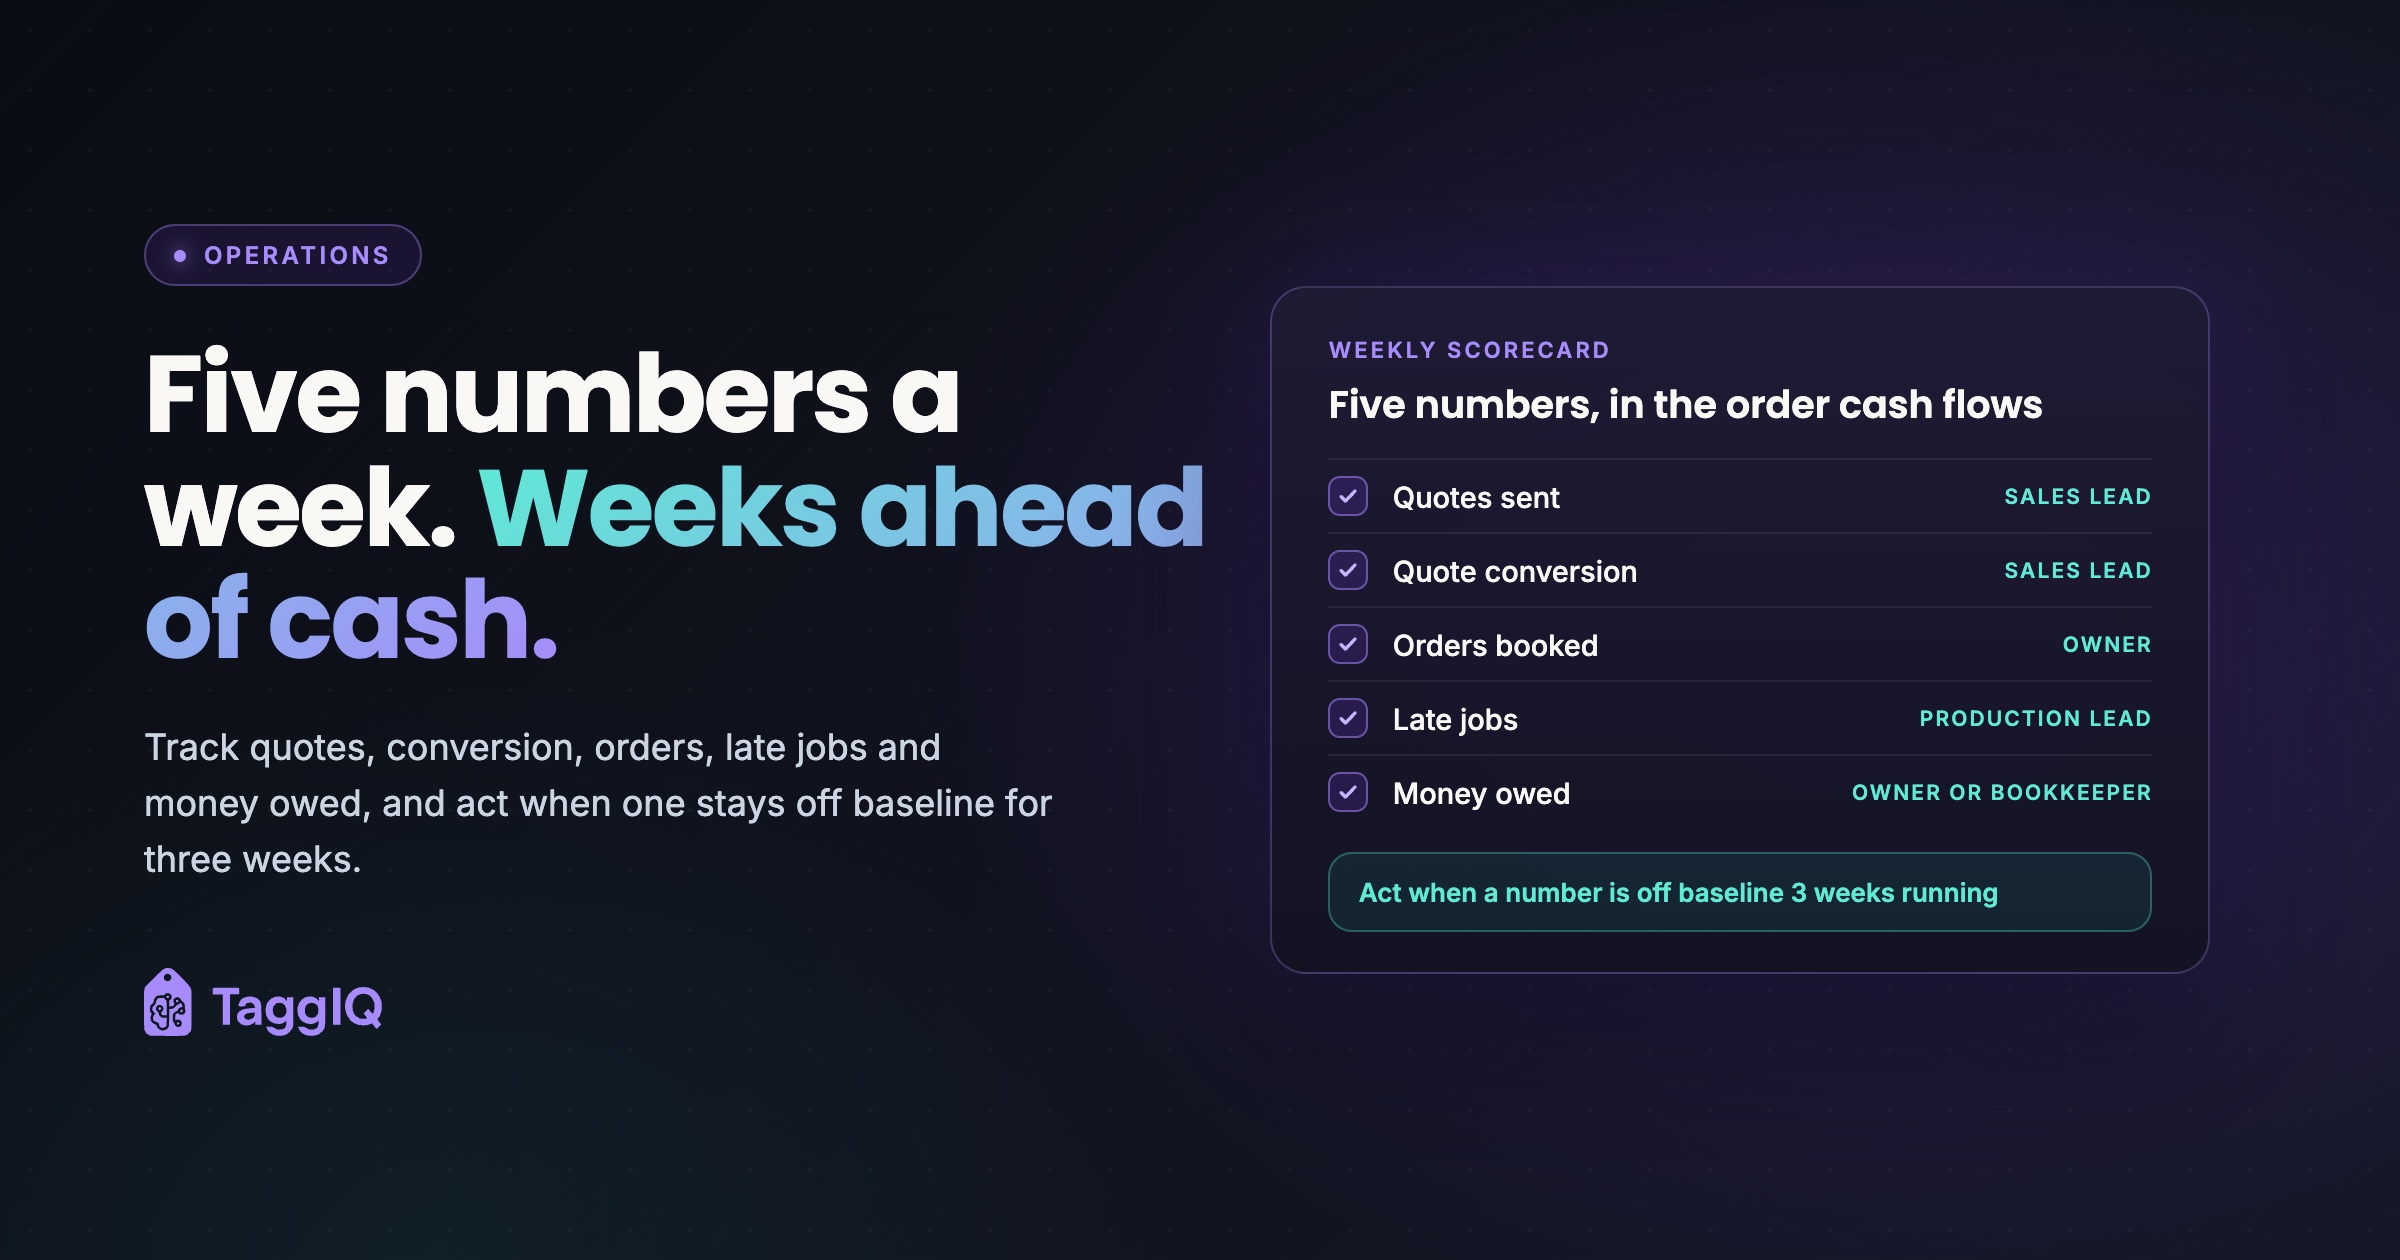
The short answer: track five weekly KPIs, in the order work moves through the shop. Quotes sent, quote conversion, orders booked, late jobs and money owed. Depending on your production and payment cycle, each can move before cash does, so a change that sticks gives you time to respond instead of a surprise.
Why the bank balance is always late
A job in a print, sign or embroidery shop moves along a path: enquiry, quote, approved order, production, dispatch, invoice, payment. Cash sits at the very end. A problem at any earlier stage only reaches the bank after every later stage has played out.
Your accountant’s month-end figures have the same limitation. They are accurate, but they record results that were settled weeks before. These are lagging indicators. The five numbers below are leading indicators: they point to what is coming, while you can still change it.
Worked example: how a quiet fortnight reaches the bank
Say quotes in a shop take about two weeks to become orders, orders take a week to produce and dispatch, invoices go out on dispatch and customers pay 30 days later. If quoting drops off in week 1, orders booked fall in week 3, invoices fall in week 4 and receipts fall around week 8. The bank balance looks normal for nearly two months after the problem started. These lags are illustrative. Work out your own by tracing a handful of recent jobs from quote date to payment date.
The five print shop KPIs, in the order cash flows
1. Quotes sent: value and count
Add up the value of every quote sent this week, excluding VAT, and count them. Record both. A rise in small quotes can hide the loss of two large ones: the count goes up while the value goes down.
Decide once how you treat revisions. A revised quote for the same job counts as one quote, at its latest value, or your figures inflate every time a customer changes a quantity.
What a change means: a sustained fall in quote value is your earliest warning. Before touching prices, check the front end. Are enquiries still arriving, and are they being quoted promptly? If quoting is slow, fix that first. Then ring the customers who ordered at this time last year and have not been in touch.
2. Quote conversion by value
A quote sent on Thursday will not have an answer by Friday, so dividing this week’s orders by this week’s quotes tells you very little. Instead, group quotes by the week they were sent (a cohort) and measure each group a fixed number of weeks later.
- Choose a measuring point, such as four weeks after sending.
- For quotes sent in a given week, add up the value that has become approved orders by the measuring point.
- Divide by the total value of every quote sent that week, including lost, expired and still-open ones.
- Report a pooled figure: total value won ÷ total value sent across the last four cohorts.
Lost and expired quotes must stay in the bottom of the sum. Leave them out and conversion looks better than it is.
Worked example: one cohort
In week 10 a shop sends 24 quotes worth £18,000 ex VAT. By week 14, seven of them have become orders worth £6,300. Conversion is 35% by value (6,300 ÷ 18,000) and 29% by count (7 ÷ 24). Winning a bigger share of value than count means the larger quotes are landing. If the two flip, with count holding and value sliding, the shop is winning small jobs and losing big ones.
What a change means: conversion falling while quote value holds points to price, response speed or follow-up. A steady, polite chase on open quotes is the cheapest fix to try first, and there is a practical approach in following up quotes without annoying customers.
3. Orders booked
Record the value of new approved orders this week, ex VAT. “Approved” means whatever your shop treats as the go signal: signed proof, purchase order or deposit received. Pick one and stick to it.
Keep this number separate from invoiced revenue. Booked orders are next month’s production and the following month’s cash. Invoiced revenue is work already done, so it cannot warn you about anything.
What a change means: orders booked below baseline for three weeks running means production will go quiet in a few weeks’ time. Fill the gap now, while it is still cheap to fill: chase open quotes, contact customers due a reorder and ask your largest accounts what they have coming up. If orders run well above baseline, check capacity before you promise dates.
4. Late jobs
At the end of each week, count the jobs past their promised dispatch date and add up their order value. Use the date you gave the customer, not an internal target, so the number matches what the customer experiences.
If you invoice on dispatch, a late job is a late invoice and therefore late cash. Late jobs also matter for next quarter, because the customer whose order slipped is the one deciding whether to come back.
What a change means: late jobs rising while orders booked stay flat point to a production problem, so find where work is queuing. Late jobs rising alongside orders point to capacity. Either way, phone the affected customers before they phone you.
5. Money owed: overdue debtors and debtor days
Take two readings from your accounting package. First, the total owed beyond agreed terms, from the aged debtors report, split by how long each amount is overdue. Second, debtor days: roughly how many days of credit sales are sitting unpaid.
Debtor days = trade debtors ÷ credit sales for the period × days in the period. Use a rolling 30 or 90 days so a single big invoice does not swing it.
Watch the VAT here. This is the one row where you should include VAT, because your debtors balance is what customers actually owe, VAT included. Use VAT-inclusive invoiced sales in the same sum, or the result comes out too high. Leave sales paid by card or cash on collection out of both figures.
Worked example: debtor days and why ageing matters
A shop has trade debtors of £24,000 and raised credit invoices of £26,000 in the last 30 days, both including VAT. Debtor days are 24,000 ÷ 26,000 × 30 = 27.7, about 28 days. Against 30-day terms, that looks fine. The aged debtors report tells a different story: £5,000 of the £24,000 is one customer’s invoice, now 75 days overdue. A steady total can hide one large invoice drifting, which is why you record both readings.
If no payment date has been agreed, GOV.UK guidance says a commercial payment is late 30 days after the customer receives the invoice or you deliver the goods or service, whichever is later. GOV.UK also explains that you can claim statutory interest of 8% plus the Bank of England base rate on late business-to-business payments, unless your contract sets a different rate. This is general guidance only, so check your own contracts and obligations, ideally with your accountant.
What a change means: debtor days creeping up for three weeks, or anything moving into the oldest overdue band, means collection calls this week, largest balance first.
Telling a real change from a bad week
Do not judge anything until you have a baseline, and you can build one from records you already hold. Pull the last 12 months of quotes sent, orders approved and aged debtors history from your job system and accounting package, and work out the weekly figure for each row those records cover. From week one, compare each week with the same week last year. School uniforms, Christmas corporate gifts and event season are then already in the comparison, so a normal seasonal swing does not look like a problem.
With no usable history, record all five numbers for six to eight weeks and average them, but flag a baseline built in a peak or a trough. Start in November and the baseline covers the Christmas gift rush, so January can sit below it for three weeks running and trigger the rule on a normal drop. Mark it as a peak baseline, do not use it to judge the quiet season, and switch to same-week-last-year once you have a year of data.
Then use one routine review rule: look into any number that sits on the wrong side of its baseline for three weeks running, or whose four-week rolling average crosses it. A single ordinary week’s movement is noise. Urgent problems do not wait for the rule: a large invoice going badly overdue or a key job about to miss its date gets action that day.
Two habits keep the numbers useful. Never change a definition partway through; if you must, restart the baseline. And stop at five. Every number you add dilutes attention on the ones that lead cash.

The one-page scorecard
Here is the template. Give each row one owner and one fixed source, so the figure is worked out the same way every week.
| Row | How to work it out | Source | Who fills it in | Prompt to act |
|---|---|---|---|---|
| Quotes sent | Value ex VAT and count, this week | Job or quoting system | Sales lead | Value below baseline 3 weeks: check enquiries and turnaround, call last year’s customers |
| Conversion | Total value won ÷ total value sent, pooled across the last four cohorts | Job system | Sales lead | Falls while quote value holds: review price, response speed, follow-up |
| Orders booked | Value of newly approved orders ex VAT | Job system | Owner | Below baseline 3 weeks: fill the production gap now |
| Late jobs | Count and value past promised dispatch date | Production schedule | Production lead | Rising: find the queue, phone affected customers |
| Money owed | Overdue total by age band, plus debtor days (incl VAT) | Accounting package | Owner or bookkeeper | Anything in the oldest band, or debtor days up 3 weeks: collection calls, largest first |
On your working sheet, give each row five more columns: this week, last week, four-week average, baseline and a one-line note. Fill it in at the same time each week, such as Friday afternoon.
Once each row has a fixed source, filling it in should take minutes. If it takes longer, it is a sign the same job is being typed into more than one place. Connecting your job system to Xero removes a lot of that re-keying and keeps the figures consistent from week to week.
Your next step
This week, write the five rows on one page, name an owner and a source for each, and record week one. Pull the same weeks from last year as your comparison; with no history, record six to eight weeks and flag any peak in the baseline. Either way, the bank balance becomes a confirmation rather than a surprise.
If your quotes, orders and invoices already sit in TaggIQ, its reporting shows pipeline value and quote-to-order conversion, lists every overdue invoice by days outstanding so you can start collection calls with the biggest amounts, compares periods and can email a weekly summary, all from the same records you quote and invoice from.
See TaggIQ reporting See how TaggIQ reporting tracks pipeline value, quote conversion and overdue invoices from your live job records.
Frequently asked questions
Where does gross margin fit if it is not one of the five?
Margin tells you whether each job is worth doing, which is a separate question from whether work is flowing towards cash. Check it per quote before it goes out and per job when it closes, then review it monthly. Keeping it off the weekly sheet stops the scorecard turning into a profit and loss account.
My system does not record when a quote was sent. What do I do?
Start a simple log today with four columns: date sent, customer, value ex VAT and outcome (won, lost, expired or open). It is enough to calculate quotes sent and cohort conversion. Once the log is a habit, you will know exactly what to ask for when you choose a job system.
I run the shop on my own. Is this worth the effort?
Yes, and it is quicker, because you own every row and every source. With no one else watching the pipeline, the scorecard is the only early warning you have. Keep the same five rows and the same three-week rule.

Dave
Dave writes for TaggIQ about running a profitable print, promo, sign and embroidery business: costing and estimating, margins, production flow, order workflows, pricing decisions and keeping customers coming back.